I use the plist and gruff gems to summarize my iTunes music ratings with Ruby
Introduction
Earlier this year I did a fresh operating system install on my laptop. Part of that install involved moving all my music from an older machine. I moved the music, but not the iTunes details. My tastes changed over the years. Why not start with a fresh listen and fresh ratings for all?
A few months passed. How much progress have I made?
First off let me roll 1d100 and check the Random Language Chart. I rolled a 73, and that means I write this in Ruby.
I decided to look at the XML file that gets exported by iTunes whenever a library detail changes. Property List XML frustrates quickly if you attack it with naive XML parsing. Fortunately, Ben Bleything wrote a plist gem that simplifies the task in Ruby.
Since I like pretty pictures, I may as well use Geoffrey Grosenbach’s gruff to make a pretty pie chart.
$ ruby --version
ruby 2.2.0p0 (2014-12-25 revision 49005) [x86_64-darwin14]
$ gem install plist
$ gem install gruff
Here It Is
No big code explanation this time around. My last few attempts at that have gone stale in my drafts folder. Plus, I’m worn out. I tried the naive XML parsing thing, and it frustrated me quickly. Thank goodness for plist.
graph-ratings.rb
require 'plist'
require 'gruff'

SOURCE = "#{ENV['HOME']}/Music/iTunes/iTunes Music Library.xml"

plist = Plist.parse_xml SOURCE
tracks = plist['Tracks']

songs = tracks.values.reject do |track|
  track['Kind'] !~ /audio file$/ || track['Genre'] == 'Podcast'
end

ratings = {}

# Group the songs by rating.
songs.each do |song|
  rating = song['Rating'] || 0
  total_time = song['Total Time'] || 0

  ratings[rating] ||= { songs: 0, time: 0 }
  ratings[rating][:songs] += 1
  ratings[rating][:time] += total_time
end

# Print it.
puts 'Rating Songs Percent Duration'

ratings.keys.sort.each do |rating|
  song_count = ratings[rating][:songs]
  total_seconds = ratings[rating][:time] / 1000.0
  seconds = total_seconds % 60
  minutes = (total_seconds / 60) % 60
  hours = (total_seconds / (60 * 60)) % 24
  days = total_seconds / (60 * 60 * 24)

  percentage = song_count.to_f() / songs.count.to_f() * 100.0
  duration = format '%02d:%02d:%02d:%02d', days, hours, minutes, seconds
  description = format '%6d %5d %6.1f%% %s', rating, song_count, percentage, duration
  puts description
end

# Graph it.
data = ratings.map { |rating, info| [ rating, [ info[:songs]]] }

graph = Gruff::Pie.new
graph.title = "Songs Grouped By Rating"

ratings.keys.sort.each { |rating| graph.data rating, ratings[rating][:songs] }

graph.write "song-pie.png"
Running it shows me that I have more than a month of music to rate, and only if I can rate music in my sleep.
Rating Songs Percent Duration
     0 13907   83.0% 38:05:56:14
    20    60    0.4% 00:03:41:48
    40   179    1.1% 00:12:28:46
    60  1351    8.1% 03:16:21:32
    80   984    5.9% 02:14:57:47
   100   273    1.6% 00:17:44:35
It seems I still like most of the music I own at least a little bit. Many former favorites have drifted to the 60 rating (3 stars), though. Time does change tastes a little bit.
The graph. Let’s look at that pretty picture.
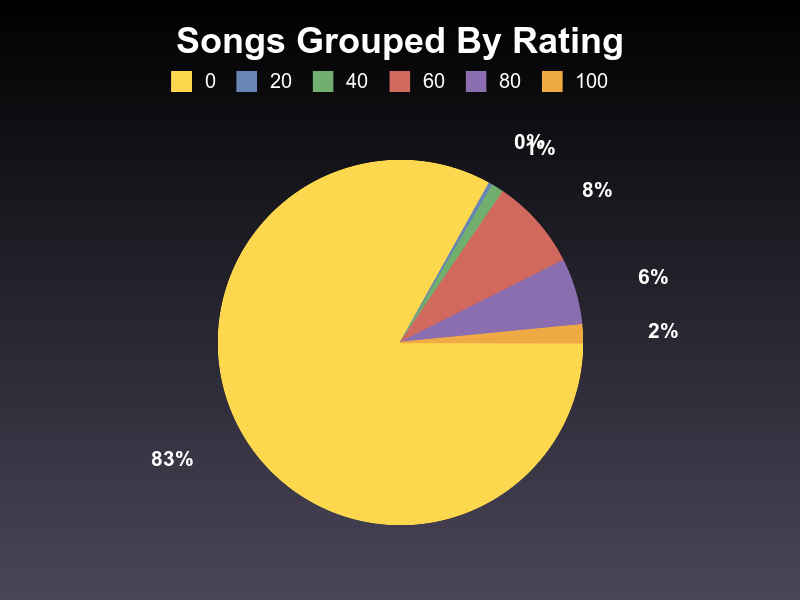
Yes. I have much music listening ahead of me.
Backlinks
Got a comment? A question? More of a comment than a question?
Talk to me about this page on:
Added to vault 2024-01-15. Updated on 2024-02-01