Been exploring Trilium for notes. One thing I’ll say is the nerdy features are directly accessible to my existing skills.
See, each note system has some way — or a plugin providing some way — to query information about your collected notes. Logseq uses Datascript, which is uh Lisp-ish? Obsidian — if you add the Dataview plugin — has DQL, which is SQL-ish.
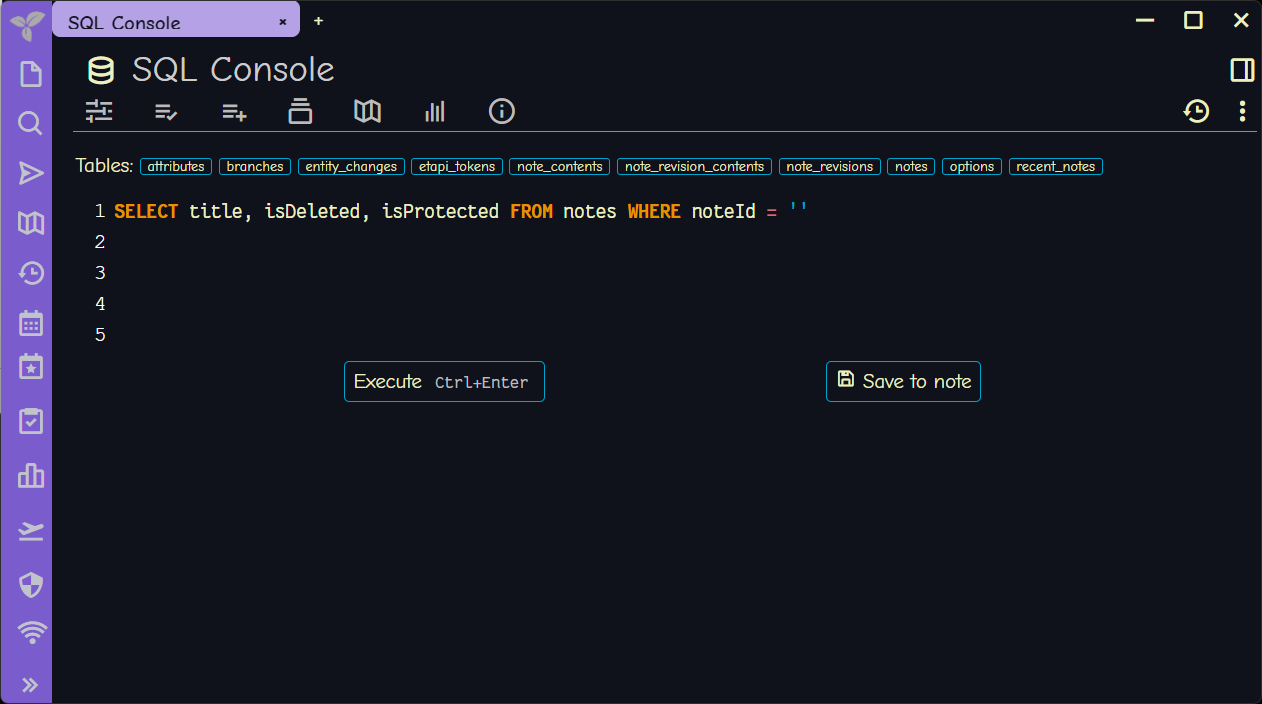
Trilium keeps everything in a SQLite database that you can query directly.
My immediate reaction on realizing what I was seeing? Look I don’t usually communicate on this site via memes and image captions, but:

I know the gist of SQL. Let’s play with this.
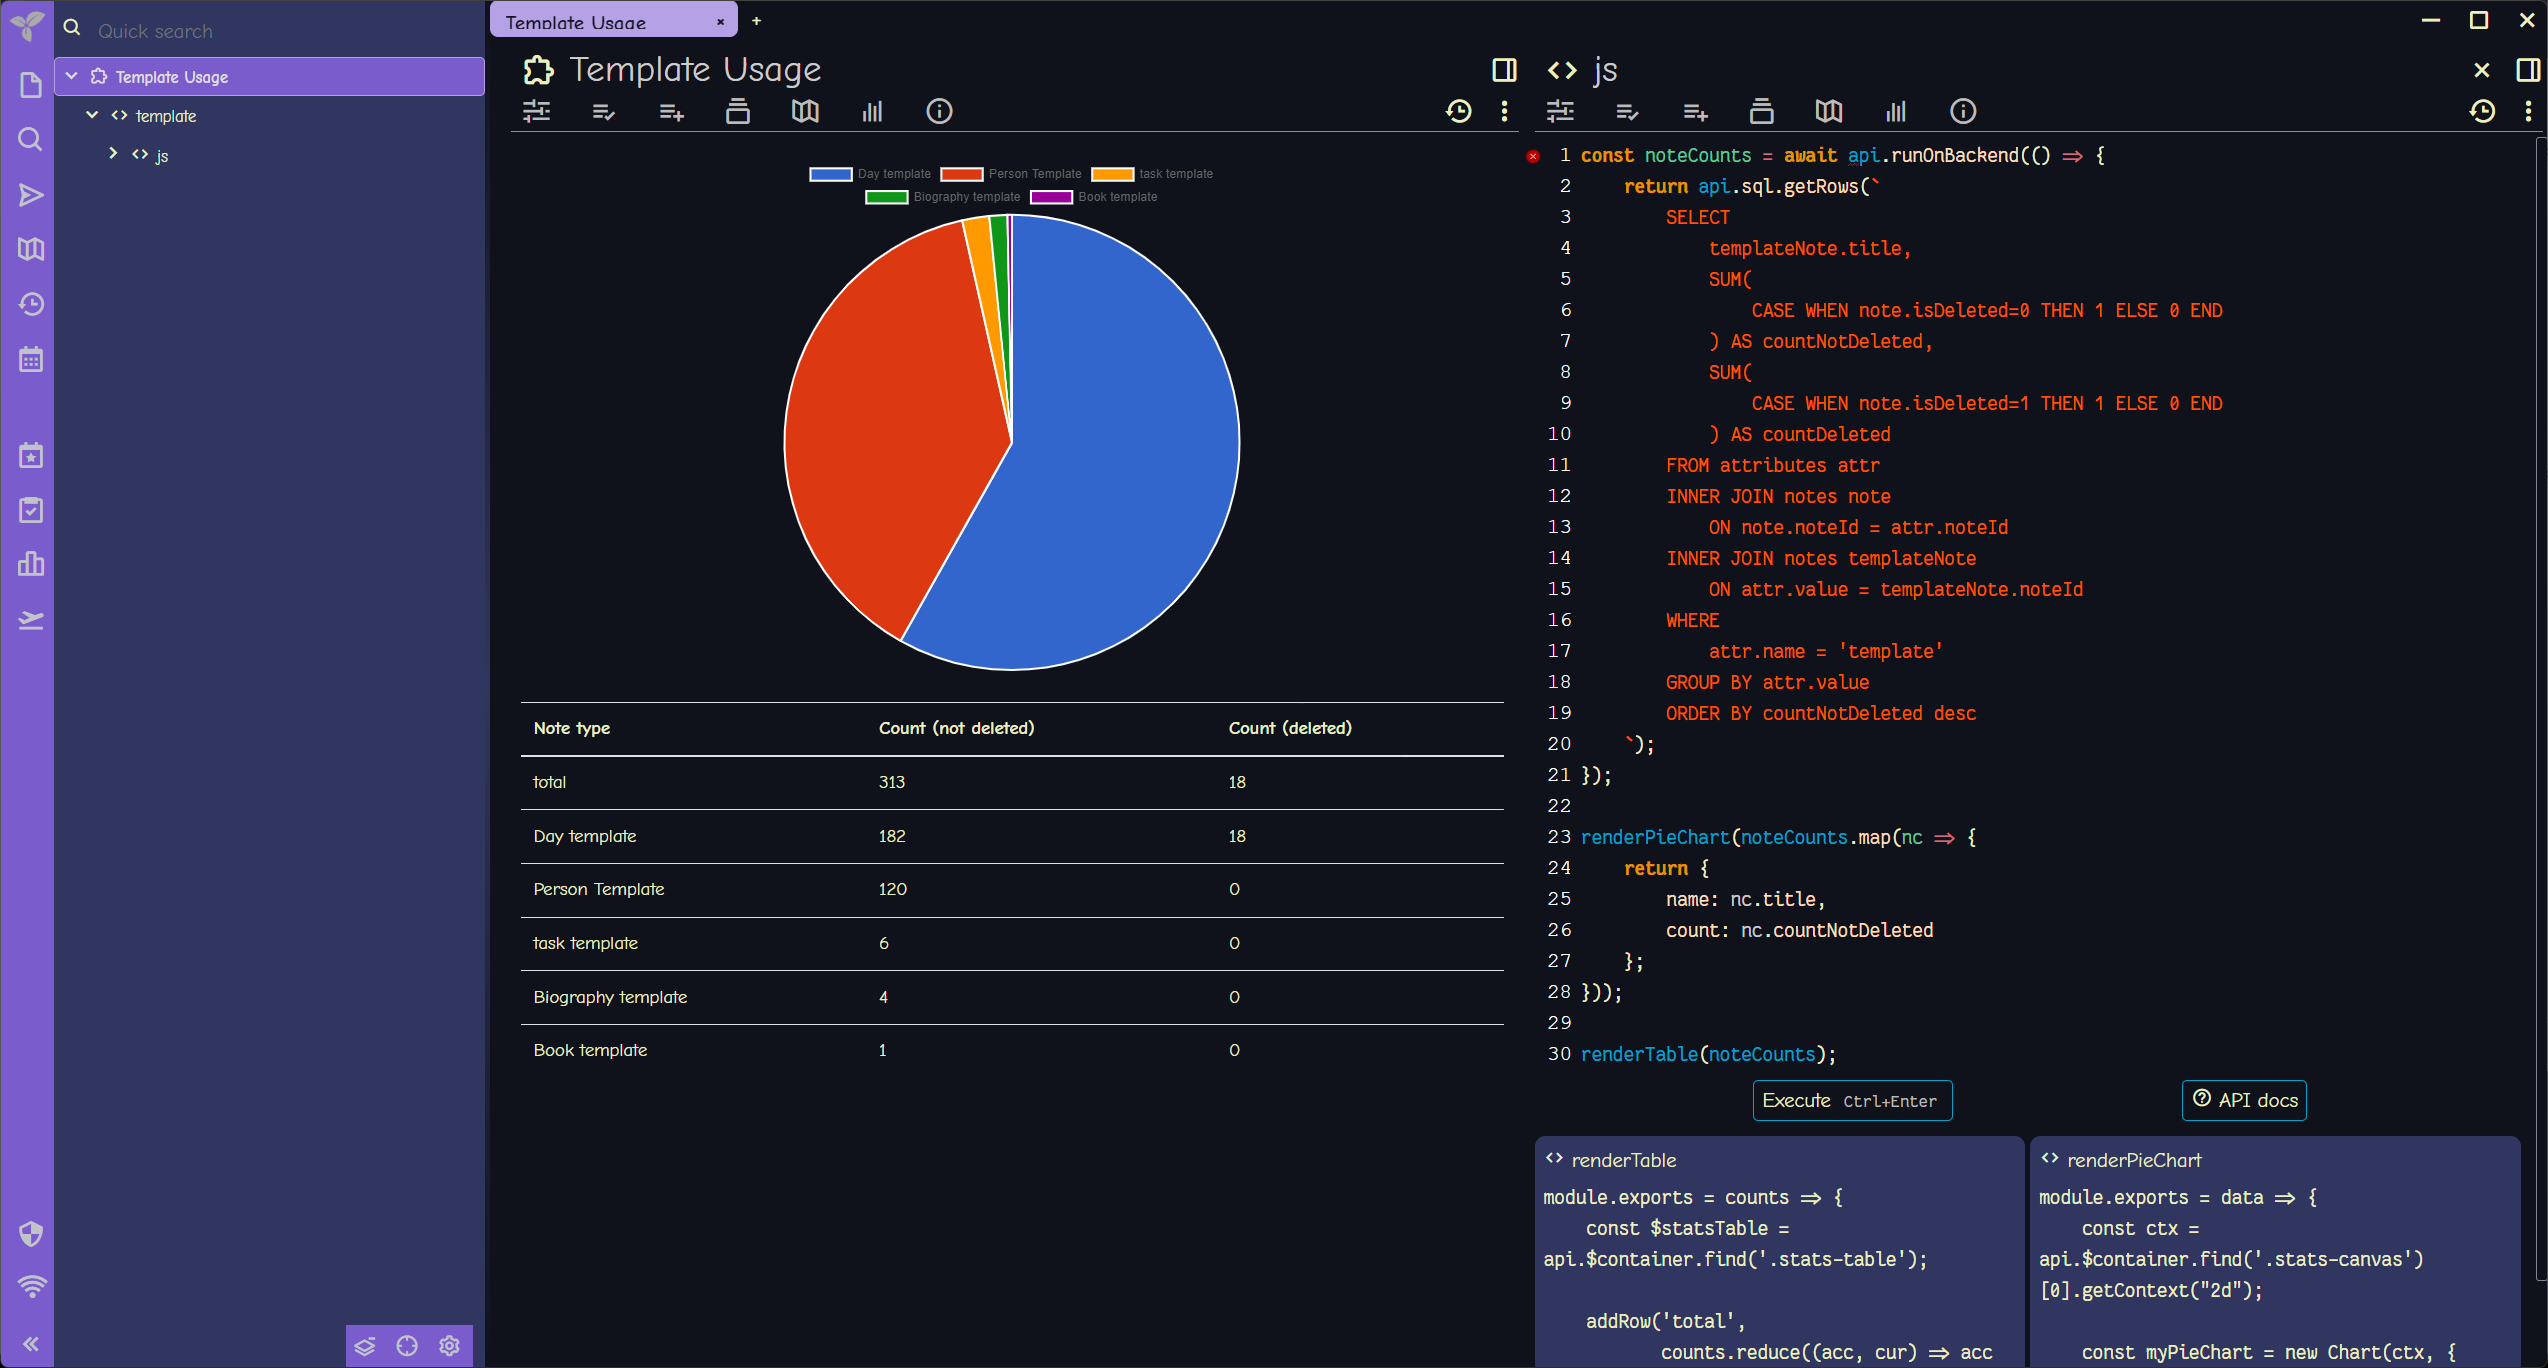
Made a custom template for notes about people. Assigned that template to the appropriate notes. Got curious about how my template-using notes were spread out.
Copied the query from Trilium Demo / Statistics / Note type count and tweaked it a little for my needs.
SELECT
    templateNote.title,
    SUM(
        CASE WHEN note.isDeleted=0 THEN 1 ELSE 0 END
    ) AS countNotDeleted,
    SUM(
        CASE WHEN note.isDeleted=1 THEN 1 ELSE 0 END
    ) AS countDeleted
FROM attributes attr
INNER JOIN notes note
    ON note.noteId = attr.noteId
INNER JOIN notes templateNote
    ON attr.value = templateNote.noteId
WHERE
    attr.name = 'template'
GROUP BY attr.value
ORDER BY countNotDeleted desc| title | countNotDeleted | countDeleted |
|---|---|---|
| Day template | 182 | 18 |
| Person Template | 120 | 0 |
| task template | 6 | 0 |
| Biography template | 4 | 0 |
| Book template | 1 | 0 |
NOTE
I renamed the Trilium demo’s included People template to Biography template for clarity here.
I duplicated Note type count, pasted my new query, then adjusted the layout JS to reflect the tweaked query.
The result:
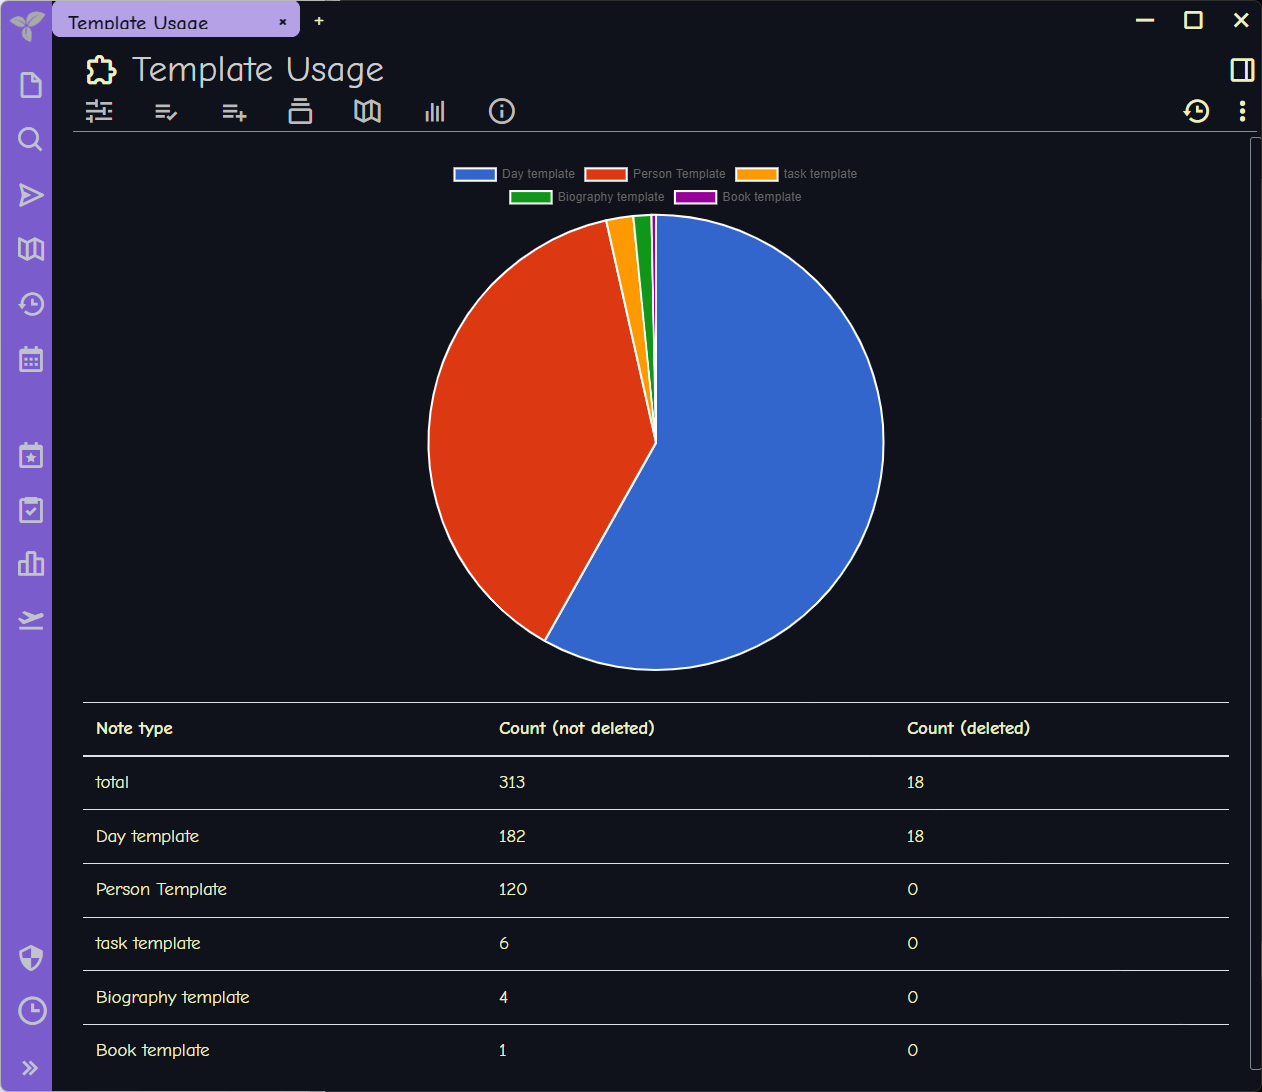
The demo graph uses Chart.js, which is fine. I’m already thinking about using Vega instead.
One thing at a time.
Trilium. It’s got SQL. I like that.
Backlinks
Got a comment? A question? More of a comment than a question?
Talk to me about this page on: mastodon
Added to vault 2024-01-15. Updated on 2024-01-26